
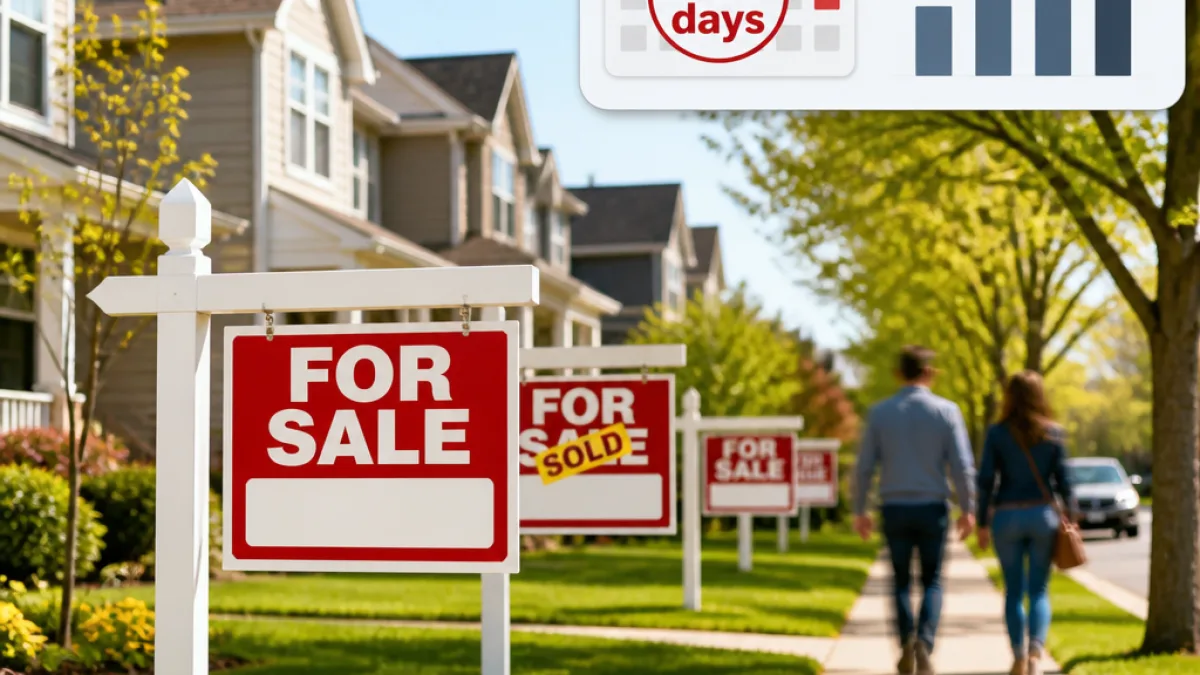
Springfield sales rise, listings increase and homes are selling faster
Springfield’s housing market showed signs of modest recovery in May 2026, according to data compiled by Redfin and distributed by Stacker. The city recorded 286 homes sold, an increase of 11.5% year-over-year, while the pool of available homes grew and the pace of sales accelerated.
Local real estate activity matters for families, investors and city planners. For potential sellers, an increase in sales combined with more active listings may signal an expanding choice of buyer demand. For buyers, fewer days on market can mean quicker competition for well-priced homes.
- Homes sold (May 2026): 286 (+11.5% YoY)
- Pending sales: 266 (+5.6% YoY)
- Median days on market: 6 (down 2 days YoY)
- Active listings: 575 (+6.0% YoY)
Two additional measures in the Redfin release give further texture to market dynamics. Just under four in 10 listings — 39.0% — sold above their original list price (a very slight drop of 0.6 percentage points year-over-year). Meanwhile, 29.2% of inventory remained unsold after 60 days, a decline of 2.1 percentage points from the prior year.
"Homes sold: 286 (+11.5% YoY)"
How Springfield compares with national trends
Redfin also published national figures for May 2026. Comparing local and national numbers shows where Springfield aligns with broader patterns and where it diverges.
| Metric | Springfield (May 2026) | U.S. (May 2026) |
|---|---|---|
| Homes sold | 286 (+11.5% YoY) | 308,446 (+5.2% YoY) |
| Pending sales | 266 (+5.6% YoY) | 350,173 (+4.5% YoY) |
| Median days on market | 6 (‑2 days YoY) | 49 (+3 days YoY) |
| Active listings | 575 (+6.0% YoY) | 1,483,839 (+0.7% YoY) |
| Share sold above list | 39.0% (‑0.6 ppt YoY) | 25.8% (‑0.8 ppt YoY) |
| Share unsold after 60 days | 29.2% (‑2.1 ppt YoY) | 53.1% (+0.3 ppt YoY) |
Those figures indicate Springfield’s market is moving faster than the national average — a median of six days on market locally compared with 49 days nationwide — and a higher share of homes sell above list price here than across the country. At the same time, the rise in active listings suggests more supply is coming onto the market.
What this means for Springfield residents
For homeowners weighing whether to list, the combination of faster sales and increasing inventory could mean timing and pricing matter more than ever. Agents in the area typically advise careful pricing and staging to capture buyer interest in a market where many homes still attract offers above list price.
For buyers, the data reinforces the need for readiness: quick decisions and pre-approved financing may be decisive in neighborhoods seeing brisk turnover. The drop in the share of inventory unsold after 60 days — now under 30% — suggests more properties are moving within shorter timeframes.
The Redfin release represents the monthly median for May 2026 and is not seasonally adjusted at the metro level. These snapshots are useful for short-term planning, but longer-term trends require watching several months of data and local factors such as interest rates, employment shifts and new construction activity.
City residents and officials who follow housing affordability, neighborhood turnover and property tax revenues will want to track whether the May uptick persists through summer and into the fall.